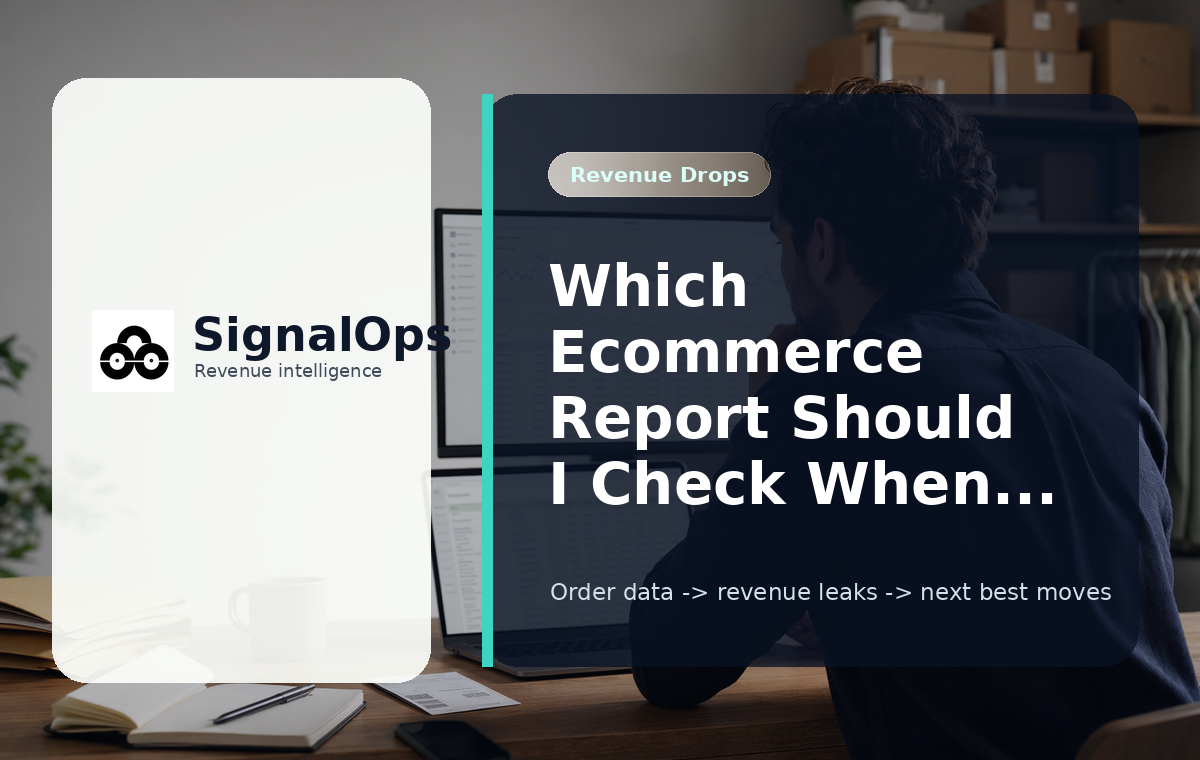
Which ecommerce report should you check first when revenue is down?
When ecommerce revenue is down, start with a revenue bridge or sales-over-time report that compares the current period against the prior period and the same period last year. The first report should tell you whether the decline came from fewer sessions, lower conversion rate, lower average order value, higher refunds, fewer repeat purchases, weaker product mix, channel mix changes, or a reporting mismatch.
The best first question is not “What campaign should we change?” It is: which part of the revenue equation moved?
Direct answer: Open your sales-over-time or revenue bridge report first. Compare gross sales, orders, sessions, conversion rate, AOV, discounts, refunds, and net revenue for the same date range. Then move through traffic, conversion, AOV, refunds, repeat purchase, product mix, channel mix, and attribution reconciliation in that order.
If traffic is down, you have a demand or channel problem. If traffic is stable but revenue is down, look at conversion rate, AOV, product availability, checkout issues, discounting, product mix, or refunds. If store revenue and ad platform revenue disagree, reconcile order-level data before moving budget.
The first report should answer these questions
- Did sessions fall? If yes, diagnose channel, campaign, SEO, marketplace, or email/SMS traffic.
- Did conversion rate fall? If yes, inspect landing pages, product pages, checkout, stockouts, promo codes, shipping costs, and payment errors.
- Did AOV fall? If yes, check product mix, discount depth, bundle attach rate, units per order, and free-shipping threshold behavior.
- Did refunds, returns, or cancellations rise? If yes, separate gross revenue from net revenue and identify the SKU, cohort, channel, or fulfillment pattern causing the leak.
- Did repeat purchase fall? If yes, review cohorts, reorder windows, lifecycle flows, subscription churn, and lapsed high-value customers.
- Did product or channel mix shift? If yes, revenue may be down because more sales came from lower-AOV, lower-margin, or higher-refund sources.
- Do dashboards disagree? If yes, reconcile store orders, refunds, payment data, marketplace/POS sales, UTMs, and attribution before changing spend.
This workflow is a diagnostic process, not a generic KPI review. The goal is to find the specific revenue leak before you discount, cut budget, change campaigns, or blame seasonality.
The revenue drop triage order: traffic, conversion, AOV, refunds, retention, mix, attribution
Revenue drops are easier to diagnose when you move in a fixed order. Do not jump from “sales are down” to “increase ad spend” or “launch a discount.” First isolate the metric that changed, then inspect the reports that explain why.
Use this revenue-drop decision tree
- Confirm the drop. Compare the current period against the prior period, the same weekday pattern, and the same period last year if seasonality matters.
- Check gross revenue, net revenue, and orders. Revenue can be down because fewer orders happened, order value fell, or refunds increased after the sale.
- Check sessions by channel. Determine whether demand fell or the same amount of traffic is producing less revenue.
- Check conversion rate. If traffic is stable but orders are down, inspect onsite performance and checkout friction.
- Check AOV. If orders are stable but revenue is down, inspect order value, discounts, bundles, units per order, and SKU mix.
- Check refunds, returns, and cancellations. If gross revenue looks fine but cash or net revenue is weak, refund drag may be hiding the problem.
- Check repeat purchase and cohorts. If acquisition looks normal but revenue is soft, returning customers may not be buying on schedule.
- Check product and channel mix. A revenue drop can come from selling more of the wrong products or acquiring lower-quality customers.
- Check attribution and reconciliation. If dashboards disagree, reconcile order-level revenue before changing budget.
Core terms operators should align on
| Metric or report | What it reveals during a revenue drop | Decision it informs |
|---|---|---|
| Gross revenue | Total sales before refunds, returns, and cancellations are removed. | Whether demand and order creation are actually declining. |
| Net revenue | Revenue after refunds, returns, discounts, and cancellations, depending on your reporting setup. | Whether sales are turning into retained revenue. |
| Orders | Number of completed purchases. | Whether the issue is order volume or order value. |
| Sessions | Visitor volume to the store or storefront. | Whether the problem starts with traffic generation. |
| Conversion rate | Share of sessions that become orders. | Whether visitors are failing to buy. |
| AOV | Average order value. | Whether revenue is down because orders are smaller. |
| Refund drag | Revenue lost after purchase through refunds, returns, or cancellations. | Whether gross sales overstate real performance. |
| Product mix | Which SKUs, collections, bundles, or categories are driving sales. | Whether customers shifted toward lower-value or higher-refund products. |
| Channel mix | Which traffic or sales channels are producing revenue. | Whether revenue quality changed because the source of demand changed. |
| Repeat purchase rate | Share of customers who buy again. | Whether retention decay is hurting revenue. |
| Cohort | A group of customers or orders from the same acquisition period, first product, or behavior segment. | Whether specific customer groups are underperforming over time. |
| Attribution | How revenue is assigned to marketing channels or campaigns. | Whether budget decisions are being made on reliable source data. |
| Blended performance | Store-level performance across all channels, not just platform-reported results. | Whether the business is improving even when individual platforms disagree. |
Recommended lookback windows
- Yesterday versus prior weekday: useful for sudden drops, broken campaigns, site issues, payment problems, or stockouts.
- Last 7 days versus previous 7 days: useful for short-term campaign, promo, email, and conversion changes.
- Last 30 days versus previous 30 days: useful for product mix, AOV, refund, retention, and channel quality changes.
- Year-over-year comparison: useful when seasonality, holidays, inventory cycles, or promotion calendars affect demand.
Always use consistent date boundaries, time zones, refund treatment, and order status filters. Many false alarms come from comparing incomplete periods or mixing gross revenue in one report with net revenue in another.
Find the revenue leak before you change budget
SignalOps helps operators connect ecommerce orders, refunds, product performance, cohorts, marketplaces, POS data, spreadsheets, and custom storefront data into one revenue-leak investigation. Diagnose whether revenue is down because of traffic, conversion, AOV, refunds, retention, product mix, or attribution mismatch before you change promotions or ad spend.
Analyze your order exportCheck traffic and conversion reports before changing promotions
If revenue is down, the next split is simple: did qualified traffic fall, or did the same traffic convert worse? This distinction prevents the most common operator mistake: launching a discount when the real issue is traffic loss, checkout friction, or a broken landing page.
When traffic is down
Open your sessions-by-channel report and compare current performance against the right baseline. Look at total sessions, then segment by channel, campaign, landing page, device, geography, and new versus returning visitors.
- Paid search or paid social down: check campaign status, budget caps, rejected ads, tracking changes, audience exclusions, creative fatigue, and landing page errors.
- Organic search down: check top landing pages, branded versus non-branded traffic, indexing issues, recent content changes, redirects, and product-page availability.
- Email or SMS traffic down: check send volume, flow activity, deliverability, segmentation changes, suppression rules, and whether scheduled campaigns actually sent.
- Marketplace or referral traffic down: check listing status, buy box changes, affiliate links, out-of-stock products, and marketplace account alerts.
- Returning traffic down: check lifecycle flow performance, reorder timing, loyalty engagement, and whether recent buyers are receiving the right post-purchase messages.
When traffic is stable but revenue is down
Stable traffic with lower revenue usually means one of four things: conversion rate fell, AOV fell, product mix shifted, or refunds increased. Start with conversion rate before assuming the audience is bad.
Conversion reports to inspect
| Check | What to look for | Likely issue |
|---|---|---|
| Landing page conversion | One campaign, page, collection, or device dropped sharply. | Broken page, mismatched offer, slow page, wrong audience, or weak creative-to-page alignment. |
| Product page views to add-to-cart | Product views remain steady but add-to-cart rate falls. | Price objection, missing sizes, poor imagery, unclear offer, low inventory, or trust friction. |
| Add-to-cart to checkout start | Carts are created but shoppers do not start checkout. | Shipping surprise, unclear promo, weak urgency, cart drawer issue, or payment expectation mismatch. |
| Checkout start to purchase | Checkout starts are steady but completed orders fall. | Payment error, promo code failure, shipping-price friction, tax surprise, fraud filter, or checkout bug. |
| Device conversion | Mobile, desktop, or tablet conversion falls disproportionately. | Device-specific layout, speed, payment, or browser problem. |
| Geography conversion | Specific regions convert worse than usual. | Shipping availability, delivery promise, tax, currency, localization, or payment method problem. |
Fast onsite checks during a revenue drop
- Place a test order on mobile and desktop.
- Test top promo codes and automatic discounts.
- Check whether bestselling products, sizes, variants, and bundles are in stock.
- Review shipping rates and delivery promises in cart and checkout.
- Check payment methods, wallet buttons, and failed transaction messages.
- Inspect site speed and major template changes on top landing pages.
- Review customer support tickets for “code not working,” “can’t check out,” or “out of stock” patterns.
If conversion is down across all channels and devices, suspect sitewide friction. If only one channel is down, suspect audience quality, offer mismatch, tracking, or campaign changes.
Use AOV, discount, and product mix reports to find order-value leaks
If orders are stable but revenue is down, check AOV next. AOV can fall because customers are buying cheaper products, buying fewer units, using deeper discounts, skipping bundles, or shifting away from high-value categories.
Do not treat an AOV drop as a pricing problem until you know whether it came from price, mix, discounting, units per order, or customer segment.
Fields to include in your AOV investigation
- Order ID
- Order date
- Gross sales
- Net sales
- Discount amount
- Discount code
- Item quantity
- SKU
- Product title
- Collection or category
- Bundle status
- Subscription versus one-time purchase
- First-order versus repeat-order flag
- Customer segment
- Margin estimate, if available
- Product attach rate
How to diagnose an AOV drop
| AOV symptom | Report to check | What it usually means | Next action |
|---|---|---|---|
| AOV down, units per order down | Units-per-order and cart composition report | Customers are buying fewer items. | Review bundles, cross-sells, free-shipping threshold, and product recommendations. |
| AOV down, discount rate up | Discount code report | Promos are reducing order value or attracting lower-quality orders. | Compare revenue, margin, repeat purchase, and refund rate by code. |
| AOV down, top SKU mix changed | Product mix report | Customers shifted into lower-priced SKUs or categories. | Promote higher-AOV collections, bundles, or attach products. |
| AOV down, first-order share up | New versus returning customer report | More orders are coming from first-time buyers who spend less. | Review acquisition quality, welcome offers, and first-order bundle strategy. |
| AOV down, repeat-order AOV down | Repeat customer order report | Loyal customers are buying smaller replenishment orders. | Use replenishment bundles, VIP offers, and subscription nudges. |
| AOV down near shipping threshold | Order value distribution report | Customers are staying below or just above the free-shipping threshold. | Test threshold messaging and add-on products. |
Pricing versus mix versus discounting
Use a three-way split:
- Pricing issue: the same products sell at lower realized prices because of markdowns, promo codes, or automatic discounts.
- Mix issue: customers are buying different products, categories, or bundles than usual.
- Behavior issue: customers are buying fewer units, skipping add-ons, or not reaching thresholds.
AOV reporting is most useful when it is tied to product and customer context. A lower AOV from a first-order acquisition campaign may be acceptable if those customers repeat. A lower AOV from repeat VIP customers may be a warning sign that your lifecycle or merchandising strategy is weakening.
Check refund and return reports to separate gross sales from net revenue
Gross revenue can look acceptable while net revenue leaks through refunds, returns, cancellations, chargebacks, or post-purchase adjustments. This is why refund reporting should be part of every revenue-drop workflow.
If your sales dashboard celebrates orders but your finance view shows weaker cash, open a refund and net revenue report before making marketing decisions.
Refund checks to run
- Refund value as a percentage of gross sales: shows how much revenue is flowing back out of the business.
- Refund rate by product or SKU: identifies products creating disproportionate revenue loss.
- Refund rate by order cohort: shows whether a specific acquisition period or promotion produced poor-quality orders.
- Refund rate by channel: reveals whether a campaign, marketplace, influencer, or affiliate source is driving returns.
- Refund lag by order date: shows when refunds appear after purchase and prevents premature performance judgments.
- Return reason: separates fit, quality, shipping damage, expectation mismatch, duplicate orders, and buyer remorse.
- Fulfillment location or carrier: identifies operational causes such as damaged shipments, late delivery, or incorrect items.
- Customer segment: shows whether first-time buyers, repeat buyers, VIPs, or discount buyers are refunding differently.
Gross versus net revenue diagnostic
| Pattern | What it suggests | Operator action |
|---|---|---|
| Gross revenue stable, net revenue down | Refunds, cancellations, discounts, or returns are increasing. | Break out refund value, discount value, and canceled orders by SKU, channel, and cohort. |
| Refunds concentrated in one SKU | Product quality, sizing, expectation, description, or fulfillment issue. | Review PDP content, support tickets, return reasons, supplier issues, and inventory batch. |
| Refunds concentrated in one campaign | Acquisition source may be overpromising or attracting low-intent customers. | Compare ad creative, landing page promise, refund rate, and repeat purchase by campaign. |
| Refunds spike after a promo | Discount may have pulled in poor-fit orders or encouraged overbuying. | Analyze refund rate by discount code and first-order versus repeat-order status. |
| Refunds appear weeks after order date | Revenue looked healthy before refund lag was visible. | Use order cohorts so recent periods are not falsely judged as profitable. |
Refund drag is especially important because it often hides below the marketing dashboard. A campaign can show strong attributed revenue while producing orders that later refund, cancel, or never repeat. The fix is not always a budget cut. Sometimes it is clearer sizing, better product education, adjusted shipping promises, stronger post-purchase onboarding, or excluding a poor-fit audience.
Use repeat purchase and cohort reports to find retention decay
Revenue can decline even when acquisition looks normal. If new customer volume is steady but repeat customers are not buying on schedule, the business may have a retention problem rather than a traffic problem.
Open repeat purchase and cohort reports when revenue is down and any of these are true:
- New customer orders look normal, but total revenue is down.
- Email or SMS revenue is weaker than usual.
- Subscription churn increased.
- Returning customer revenue declined.
- Customers who normally reorder after a set window are quiet.
- High-value customers have not purchased recently.
Retention reports to check
| Report | What to inspect | What it tells you |
|---|---|---|
| Repeat purchase rate by monthly cohort | Customers acquired in each month and their second-order behavior. | Whether recent cohorts are lower quality or lifecycle timing is failing. |
| Days since last order | Customer groups past their normal reorder window. | Who should have bought again by now. |
| First product purchased | Repeat rate by first SKU or collection. | Which products create strong or weak customer relationships. |
| Second-order conversion | Share of first-time buyers who place a second order. | Whether post-purchase education and lifecycle flows are working. |
| Subscription churn | Cancellations, skips, failed payments, and paused subscriptions. | Whether recurring revenue is leaking. |
| Email/SMS engagement | Flow revenue, campaign revenue, clicks, unsubscribes, and segment size. | Whether lifecycle channels are reaching and converting customers. |
| Lapsed high-value customers | VIPs or high-LTV customers with no recent order. | Whether the most valuable customers need save or winback action. |
Operator actions when repeat purchase is down
- Trigger replenishment reminders based on the real reorder window for each product.
- Send winback flows to customers who are past their expected next purchase date.
- Create post-purchase education for products that have low second-order conversion.
- Build VIP save campaigns for high-value customers who have gone quiet.
- Use cohort-specific offers instead of blanket discounts for the whole list.
- Review subscription churn reasons before assuming churn is only price-driven.
- Compare first-product cohorts to identify SKUs that acquire customers who do or do not come back.
Retention diagnostics should connect customer behavior to products and channels. A cohort acquired through one campaign may place many first orders but few second orders. Another cohort may buy lower AOV at first but become stronger repeat customers. Revenue-drop analysis should separate those patterns before declaring a channel good or bad.
Check channel, attribution, and reconciliation reports before moving budget
When revenue is down, attribution dashboards can create false confidence or false panic. One platform may claim strong revenue while store orders are flat. Another may appear weak because tracking broke, UTMs changed, delayed conversions are missing, or customers bought through marketplace, POS, or direct channels instead.
Before moving budget, reconcile order-level revenue against the reports your team uses to make decisions.
Attribution and reconciliation checks
- Platform-reported revenue versus store orders: compare ad platform revenue to actual order revenue for the same period.
- UTM coverage: check whether campaigns, emails, affiliates, and influencers are tagged consistently.
- Last-click revenue: compare last-click reporting against platform-attributed revenue and blended results.
- Blended ROAS or MER: evaluate total revenue against total ad spend when platform attribution is noisy.
- CAC: compare customer acquisition cost by channel, campaign, and cohort quality.
- Email/SMS revenue: confirm whether flow and campaign revenue are counted consistently with store orders.
- Marketplace and POS sales: include non-storefront sales if the business operates across multiple channels.
- Delayed conversions: check whether conversion windows or reporting lag make recent periods look worse than they are.
- Ad account changes: review budget shifts, campaign structure changes, pixel events, catalog changes, and audience edits.
- Tracking outages or integration gaps: identify missing data before interpreting performance.
When should you distrust surface-level dashboard numbers?
| Warning sign | Why it matters | What to reconcile |
|---|---|---|
| Ad platform revenue is up, store revenue is down | Attribution may be over-crediting or double-counting. | Order IDs, conversion dates, UTMs, refunds, and new versus returning customers. |
| Store revenue is up, channel dashboards are down | Tracking may be missing conversions or channel mix shifted. | Direct, organic, email, marketplace, POS, and unattributed orders. |
| Email revenue changed suddenly | Flow edits, tracking changes, or attribution settings may have shifted. | Campaign sends, flow status, clicks, coupon usage, and order timestamps. |
| Paid revenue down after tracking change | The business may not have changed; measurement may have. | Pixel events, UTM structure, checkout events, and blended performance. |
| Finance revenue does not match dashboard revenue | Refunds, taxes, shipping, discounts, cancellations, or payment timing may be treated differently. | Gross sales, net sales, refunds, taxes, shipping, payment captures, and accounting exports. |
The safest rule is simple: do not change budget based only on attributed revenue if order-level revenue is not reconciled. Use attribution to form hypotheses, but use store orders, refunds, cohorts, and blended performance to validate them.
Revenue drop report checklist and next actions
Use this checklist during weekly revenue reviews or emergency sales-drop investigations. Start at the top, isolate the symptom, then move to the most relevant report and action.
| Symptom | Report to check | Export fields needed | Red flags | Likely cause | Next action |
|---|---|---|---|---|---|
| Traffic down | Sessions by channel | Date, channel, campaign, landing page, device, geography, sessions | One channel or landing page dropped sharply | Campaign issue, SEO decline, email send gap, marketplace problem, or tracking change | Audit campaign status, landing pages, email sends, organic pages, and channel-specific alerts |
| Traffic stable but revenue down | Revenue bridge | Sessions, orders, conversion rate, AOV, discounts, refunds, net revenue | Orders, AOV, or net revenue fell while sessions held steady | Conversion issue, AOV leak, product mix shift, refund drag, or checkout friction | Move through conversion, AOV, refunds, and product mix diagnostics |
| Conversion down | Funnel report | Sessions, product views, add-to-cart, checkout starts, purchases, device, page | Add-to-cart or checkout completion dropped | Broken page, stockout, promo code failure, shipping friction, payment issue, or weak audience fit | Test checkout, promo codes, top PDPs, shipping rates, inventory, and device-specific experience |
| AOV down | AOV and cart composition report | Order value, item quantity, SKU, category, discount, bundle flag, customer type | Units per order, bundle attach, or high-AOV SKU share declined | Product mix shift, discounting, fewer add-ons, or threshold behavior | Review bundles, cross-sells, discount depth, free-shipping threshold, and high-AOV merchandising |
| Refunds up | Refund and return report | Order ID, SKU, refund amount, return reason, channel, cohort, fulfillment location | Refunds concentrated by SKU, campaign, cohort, or location | Product issue, expectation mismatch, poor-fit traffic, fulfillment problem, or promo-driven returns | Fix product content, sizing, support, fulfillment, acquisition promise, or campaign targeting |
| Repeat purchase down | Cohort and repeat purchase report | Customer ID, first order date, first product, order count, days since last order, segment | Recent cohorts fail to place second orders or reorder on schedule | Lifecycle decay, weak first-product experience, poor cohort quality, or subscription churn | Trigger winback, replenishment, post-purchase education, VIP saves, and cohort-specific offers |
| One product category down | Product performance report | SKU, collection, units sold, revenue, margin estimate, inventory, refunds, channel | Category revenue down despite stable traffic or demand elsewhere | Inventory issue, merchandising change, price resistance, competitor pressure, or seasonality | Check inventory, PDP changes, pricing, collection placement, campaigns, and substitution products |
| Paid revenue down | Channel and campaign report | Spend, sessions, orders, CAC, ROAS, UTMs, campaign, new customers, refunds | Spend stable but orders, conversion, or cohort quality fell | Audience fatigue, creative mismatch, landing page issue, tracking outage, or lower-quality acquisition | Compare platform revenue to store orders, inspect UTMs, review creative and landing pages, and validate cohorts |
| Email revenue down | Email/SMS performance report | Flow status, campaign sends, clicks, revenue, coupon usage, segment size, unsubscribes | Flow revenue, clicks, or send volume dropped suddenly | Paused flow, deliverability issue, segmentation change, broken link, or weaker offer | Audit flow status, recent edits, links, coupons, suppression rules, and lifecycle segments |
| Dashboard numbers do not match finance | Reconciliation report | Order ID, gross sales, net sales, discounts, refunds, taxes, shipping, payment status, channel | Store, ad, analytics, and accounting totals disagree | Different revenue definitions, refund timing, duplicate attribution, missing channel data, or integration gaps | Reconcile order-level exports before changing budget, forecasts, or promotions |
Final operator rule
Do not react to revenue being down until you know which metric moved and whether the number is reconciled. A traffic problem needs a different response than a checkout problem. An AOV problem needs a different response than a refund problem. A retention problem needs a different response than an attribution mismatch.
The right ecommerce report is the one that narrows the cause. Start with the revenue bridge, then work through traffic, conversion, AOV, refunds, repeat purchase, product mix, channel mix, and reconciliation. Once you know where the leak is, your next action becomes much clearer.